
Intro to Key Bitcoin Charts
Below are a few key charts everyone should know

These charts will help readers understand the impact of the halving cycles, the history of bitcoin’s prices, and the potential future price.
Halving Cycles Linear
Halving Cycles Stacked
Stock to Flow (S2F)
Stock to Flow X (S2FX)
Halving Cycles Linear
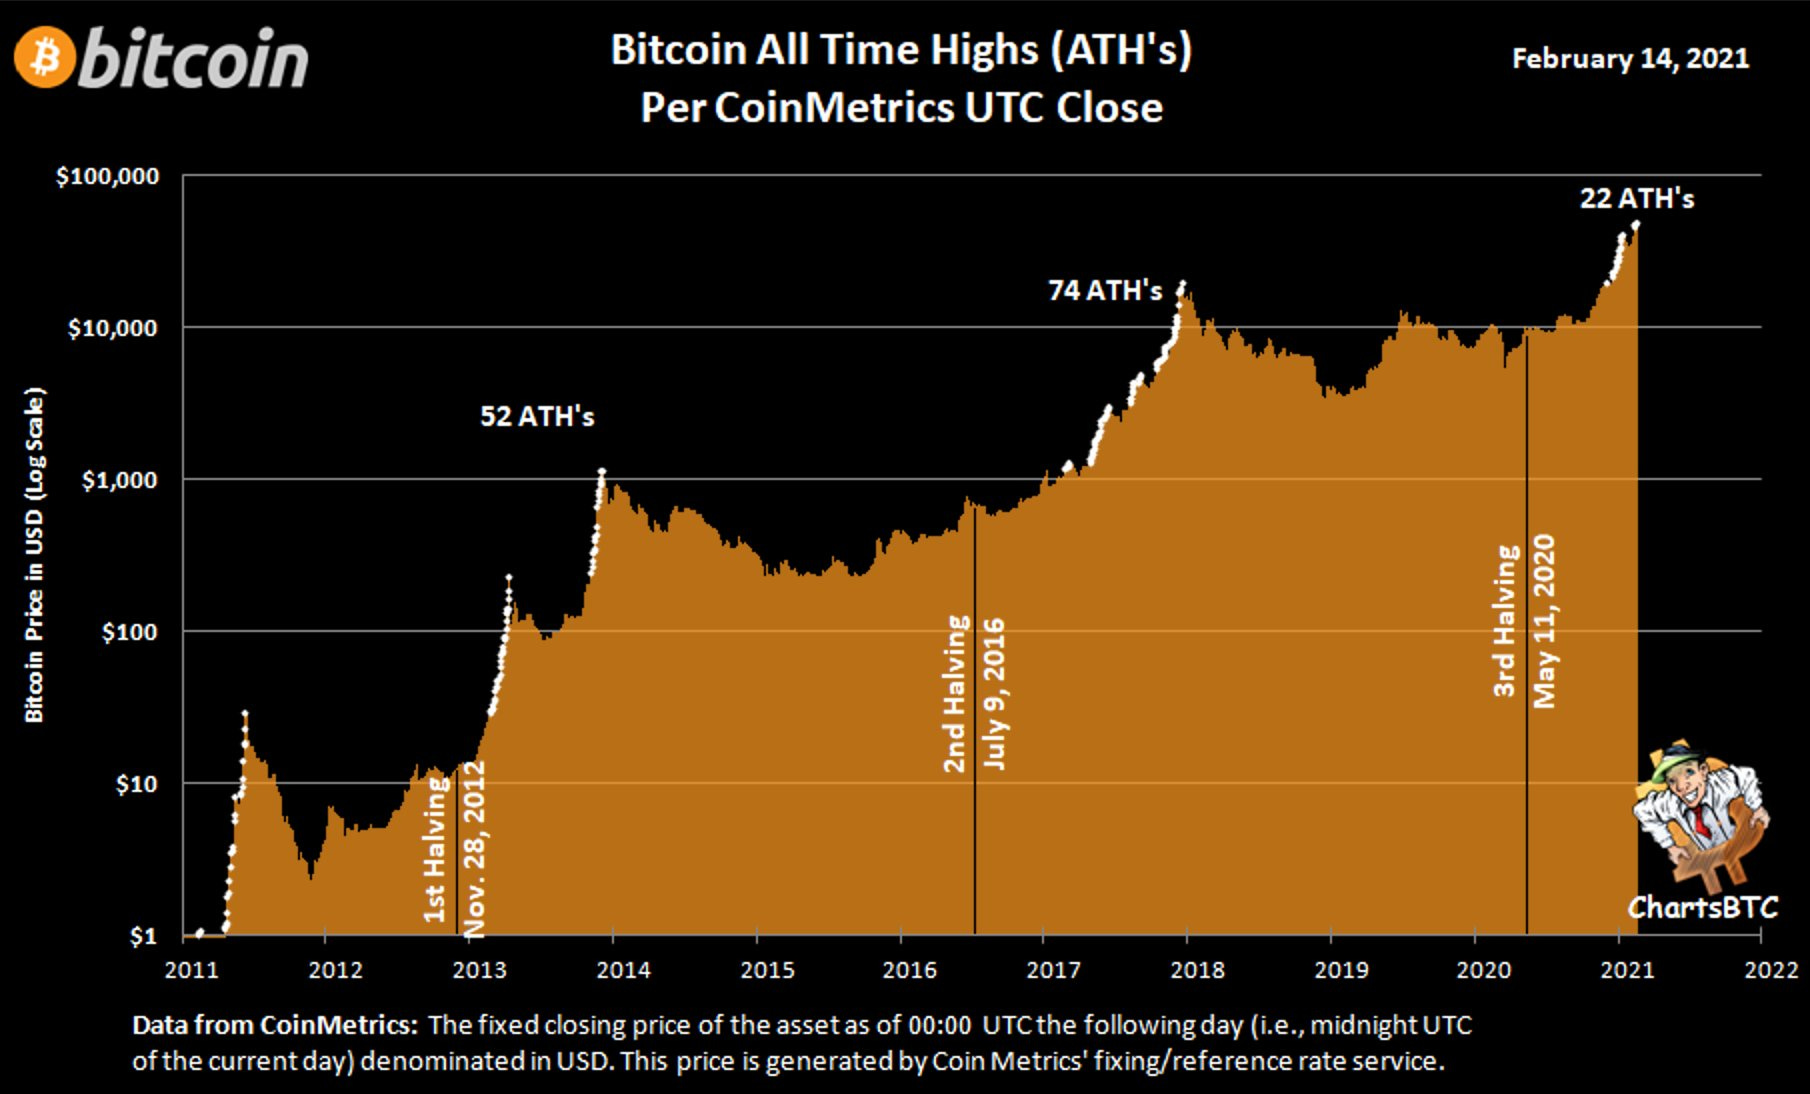
Every 4 years the total new supply of bitcoin is cut in half. Next, bitcoins become more scarce as they move toward the total supply limit of 21M. In the chart above shows where the 3 halving cycles occurred and a similar pricing trend after each cycle. We are currently in the 3rd halving cycle.
Halving Cycles Stacked
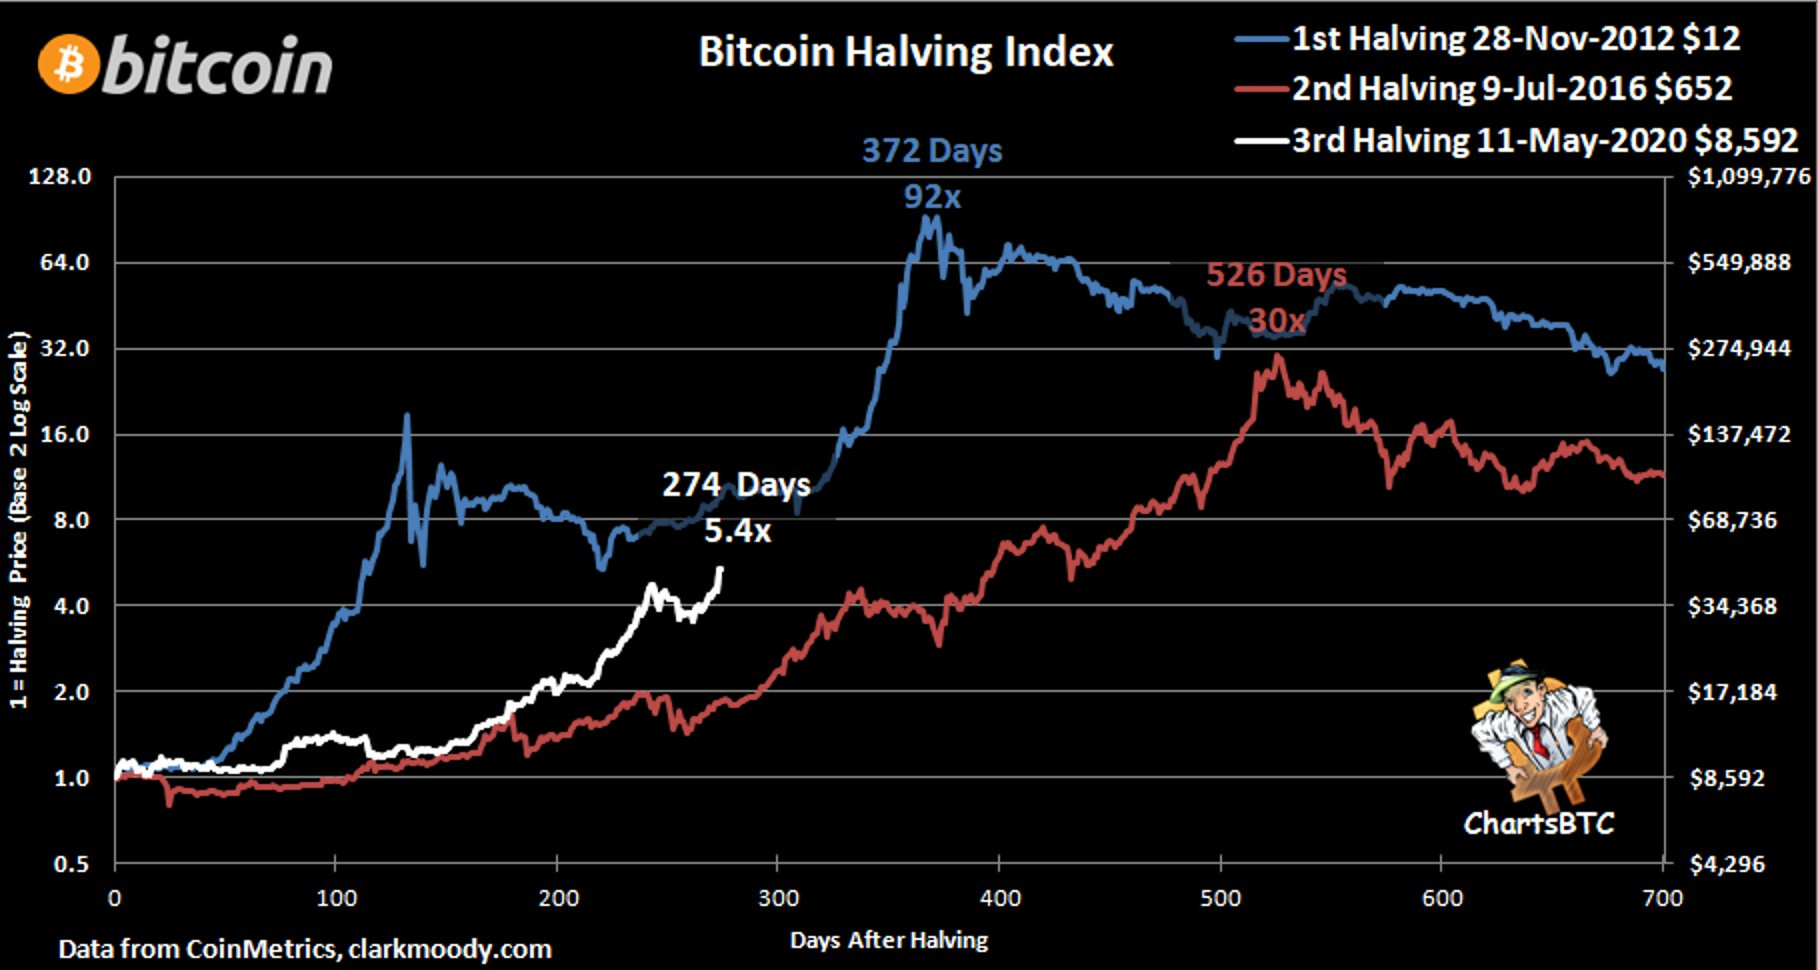
The blue line represents the price change after the first halving cycle. The red line represents the price change after the second halving cycle. The white line represents the current halving cycle price change. Note that the first halving cycle topped out 372 days after the halving start. The second halving topped 526 days after the halving start. This chart was published on Feb 9, 2020. So, if the 3rd halving cycle follows the 1st halving cycle timeline exactly then the top will be in May, 2020. If the 3rd halving cycles follows the 2nd halving cycle timeline exactly then the top will be in October, 2020. From this chart we can tell no two cycles are the same.
Stock-to-Flow

Stock-to-Flow (S2F) measures how increasing scarcity impacts price after each halving cycle. In this chart we can see that the colors of each dot are correlated to how many months are left in the halving cycle. As the dots transition from dark red at the beginning of each halving cycle to light red and dark yellow the price trends up. After the dots begin to turn yellow the price begins to trend down as Bitcoin enters a bear market and long winter with dark green dots. Next the price is stable and lifts upward they turn dark blue and the next halving cycle begins. The S2F model has a price target of $100K for the 3rd halving cycle. This chart pictured above is from Feb 2, 2020. Here is the full Medium article by the inventor who goes by the pseudonym PlanB.
Stock-to-Flow X

Stock-to-Flow X (S2FX) compares bitcoin to other store of value assets like silver, diamonds, gold, and real estate. In this chart, when months until halving goes from 0 to 40 months the line zooms horizontally from the dark blue dot to the dark red dot. The red dot zooms across because bitcoin halving was cut in half and bitcoin becomes more scarce. From the red dot the proceeding dots move upwards as the price increases. The pattern repeats itself for the 1st, 2nd, and 3rd halving. This chart also shows the market cap of other store of value assets and where bitcoin’s market cap and scarcity are in comparison. The current S2FX model targets a bitcoin price top at $288K. Plan B has said he a few times on air that he prefers the S2FX model over the S2F model. More details are on S2FX are also covered in the same Medium article by the inventor, PlanB.